Methane Emissions from Oil and Gas Majors
Methane Emissions from Oil and Gas Production
The IPCC has estimated that cutting methane emissions quickly in the 2020s could take 0.2 degrees centigrade off the rise in global temperatures in the long run. It is also an area of the transition in which there is consensus that action now could lead to relatively quick impact in reducing climate impacts, because although methane is more potent than carbon dioxide as a greenhouse warming gas, it also decomposes in the atmosphere far quicker. Against that background, a number of initiatives and regulations in jurisdictions have emerged to drive reductions. The IRA, passed in the USA in 2022, contains provisions to charge a levy against methane emissions from oil and gas producers, which is expected to cost producers in excess of a billion dollars in 2024, while in the European Union regulations are just about to come into effect which schedule company reporting on methane according to ever tighter standards, culminating in the setting of a maximum level of allowable emissions for all companies exporting oil and gas into the 27 countries of the union. In the multilateral space, the Global Methane Pledge has signed up 120 countries pledged to produce emissions by at least 30% by 2030 from 2020 levels. Companies representing nearly 40% of total oil and gas production have signed up to the Oil and Gas Methane Partnership 2.0, which aims to move reporting on methane from estimates to high quality measurement and reduce emissions.
Doubt About the Numbers
As ambitious goals have come into play, it has become clear that there are widely diverging estimates of emissions. Most numbers published hitherto by companies and governments have been on a projection basis – i.e. they are not measurements. Data from satellites are beginning to enter public domain and are being integrated into estimates, but it is not yet clear what proportion of emissions will be detectable by the current generation of satellites, and how so-called “top down” and “bottom up” estimation methodologies will be integrated and reconciled.
The International Energy Agency in its Methane Tracker Report for 2024 presented a stark divergence of estimates at the global level. While its own estimate for methane emissions from the oil and gas industries reached 77 million tons in 2023, that of reports submitted to the UNFCCC totaled half that, or 38 million tons. Meanwhile if the emissions levels reported by companies into the OGMP were scaled to cover all global production (though some, admittedly, do not cover the full scope of corporate operations globally), they would reach just 5 million tons. There is thus a difference of 15-fold between the IEA estimates and the weighted average of corporate reporting. The IEA’s estimate of about 80 million tons of methane emissions for oil and gas is itself on the low side compared to other estimates which go as high as 140 million tons per year.
This figure shows the estimated methane emissions attributed to various Oil and Gas companies for the year 2022, based on their reported production totals and IEA's emission intensity profiles. This is compared against the UNFCCC's estimates for missions in 2020 and the companies' self-reported emissions totals for 2022.
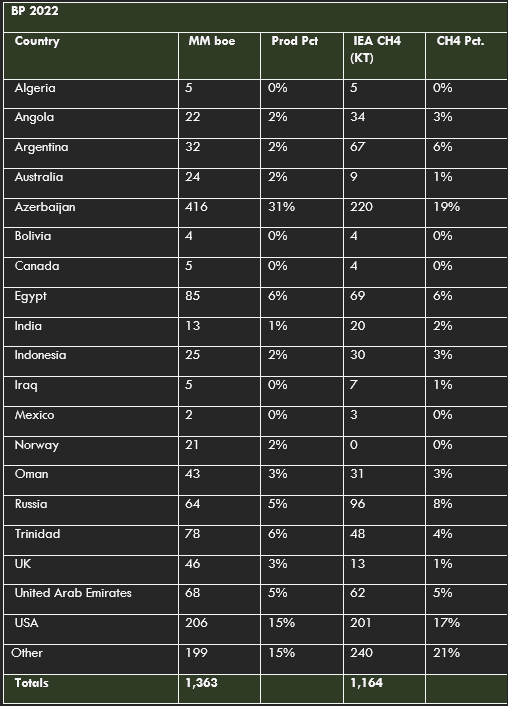
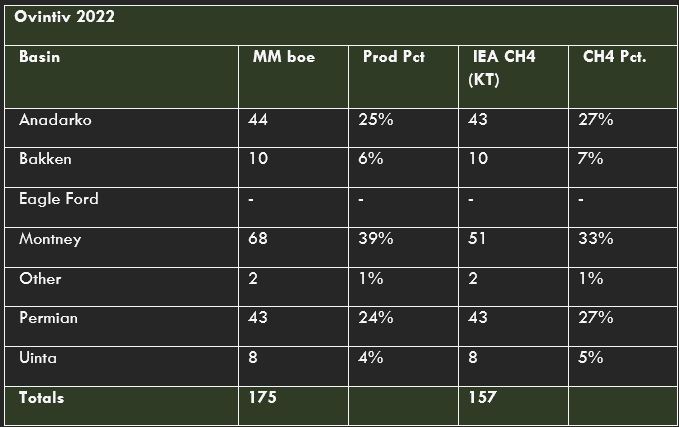
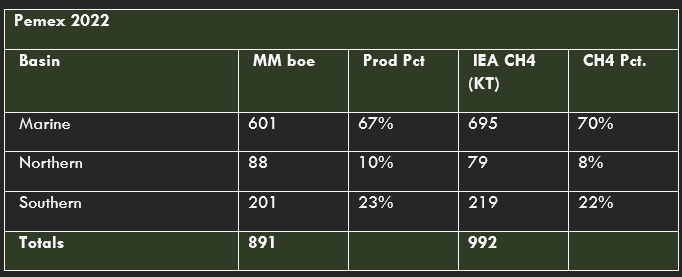
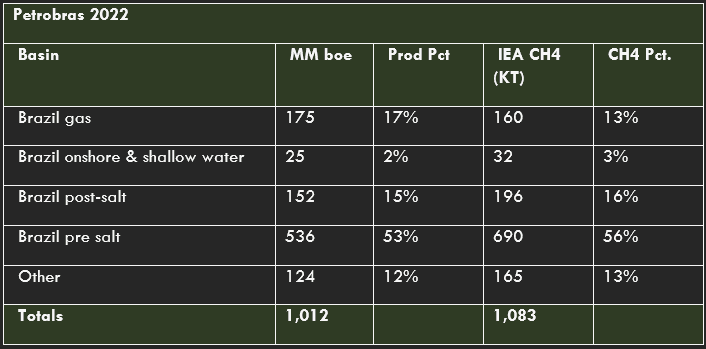
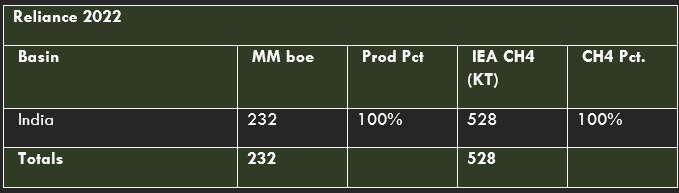
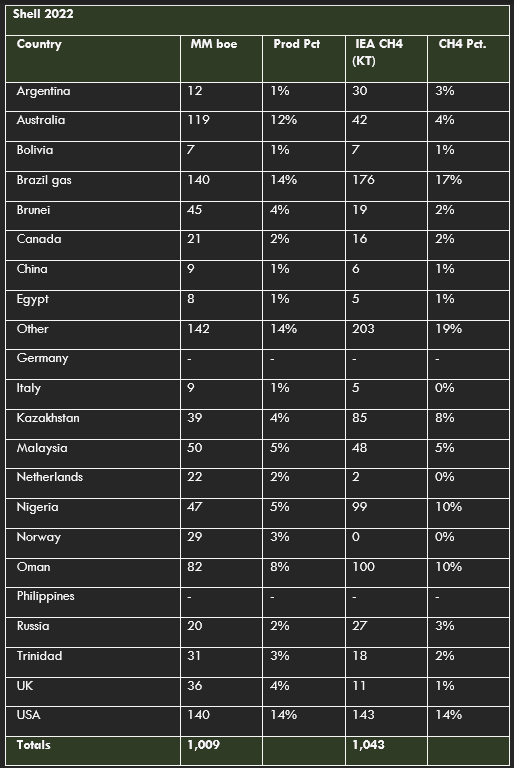
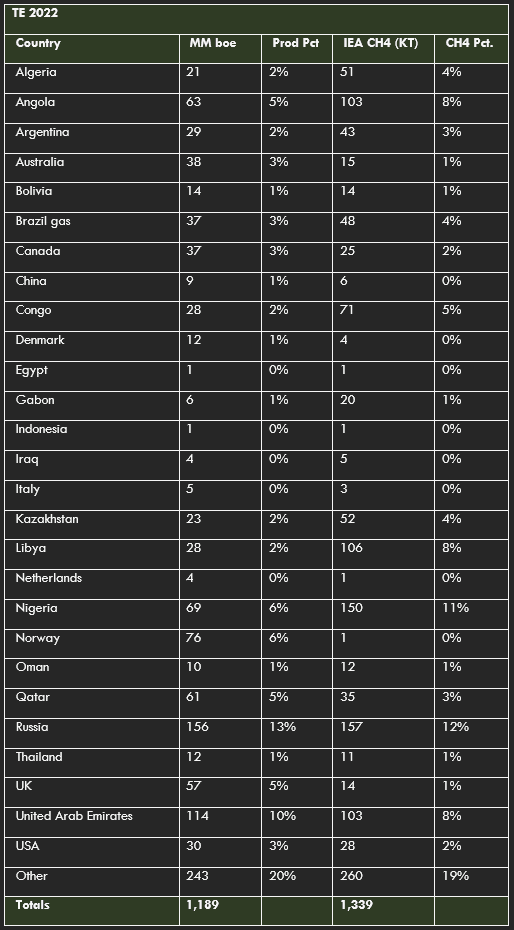
Subsequent pages break down the companies' production total and emissions estimate by country, region, or basin depending on the company's reporting practices, alongside the emissions estimates and reported emissions for each company.
Summary Results of Implied Emissions at Company level
As part of its mission to curate fossil fuel industry emissions numbers from divergent sources, the Global Registry of Fossil Fuels has compared methane emissions numbers published by ten major oil and gas companies with two other emissions projection methods derived from global data sets, one from the IEA’s Methane Tracker data set, and the other from reports submitted by governments on upstream oil and gas methane emissions to the UNFCCC in 2020.
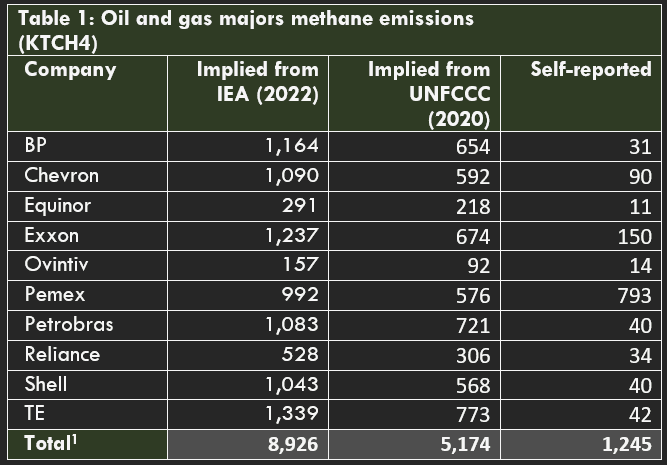
The divergences are stark, as Table 1 shows. The companies themselves reported emissions equivalent to just under 1.25 million tons of methane in the year 2022, on production of just under 9 billion barrels of oil equivalent (about one seventh of total oil and gas production in that year). But by allocating the IEA’s top-down estimates at country level to the production portfolios of those countries, a different estimate of over 9 million tons is arrived at. Projections submitted by governments to the UNFCCC process produces a lower figure of five million tons, but it is still four times higher than the cumulative methane emissions reported by these companies for this production.
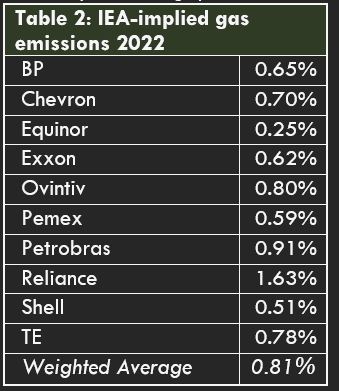
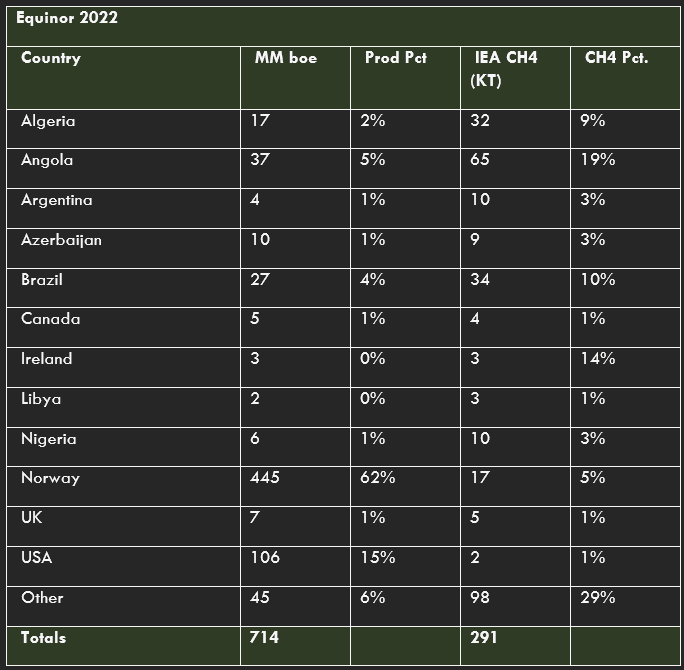
If gas production alone is taken (Table 2) all companies exceed the OGCI target level of 0.2% methane emissions by volume of gas sold. Equinor comes closest, at 0.25% but likely high emissions in several of its equity-basis projects drive up average emissions intensity at the portfolio level. The figures for 2022 are the latest available. Although eight out of the ten companies studied have reported production for 2023, they have not issued methane emissions estimates for the period that would allow comparison with the latest IEA Methane Tracker data.
One reason for the divergence could be that the IEA and UNFCCC-derived methods are applied to all the oil and gas production a company owns, whereas the company’s own methane estimates may be based on a sub-set of that. To the extent this is true, it would represent a gap in corporate methane reporting.
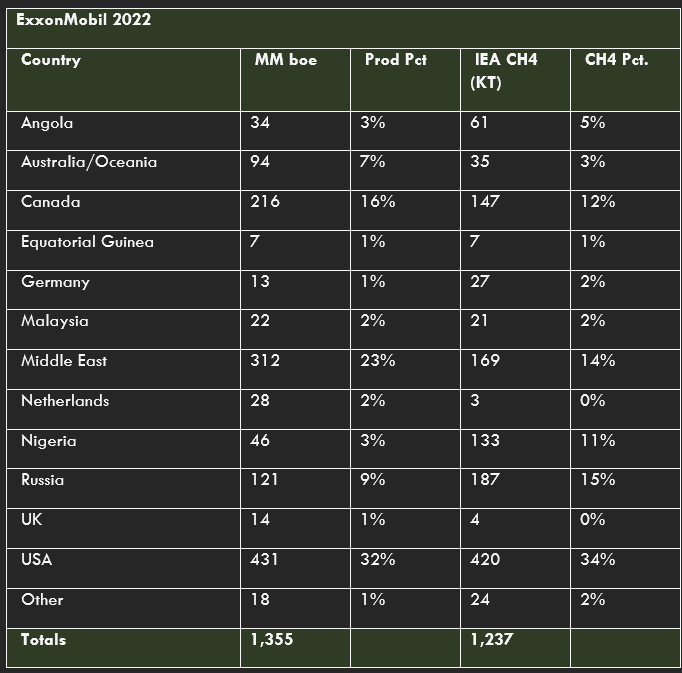
Within the 93 reporting companies in OGMP, emissions on operated assets were estimated to be 0.9 million tons, with an additional 0.7 million tons in additional assets held on an equity basis. This would suggest an absolute maximum margin of uncertainty around this factor of 77%. Individual companies within this study show a much lower variance. In 2022, for example, ExxonMobil reported 140 KT of emissions on an operated basis and 150 KT on an equity basis, a difference of 7%. Chevron likewise showed variance of 22% between operated and equity basis in the same year.
In the case of Equinor, for example, 62% of the company’s production on an equity basis came from its home country Norway but had implied methane emissions of less than 5% of the company’s total worldwide portfolio. Whereas Angola was responsible for 5% of Equinor’s production but 19% (IEA) of its global methane emissions.
Similarly, production in countries like Angola (BP, Chevron, Equinor, ExxonMobil, TE), Nigeria (Chevron, Equinor, ExxonMobil, Shell, TE), or Kazakhstan (Chevron, Shell, TE) occupy a higher proportion of methane emissions than of production. Another area of potential divergence is in system boundaries. Companies have not standardized the bounds of systems where they report emissions, and some of the gaps between UNFCCC and IEA estimates could be due to defining upstream and midstream in different places along the value chain. It is also possible that these companies have lower than average emissions. But the divergence in numbers is so great that it can be entirely accounted for by this.
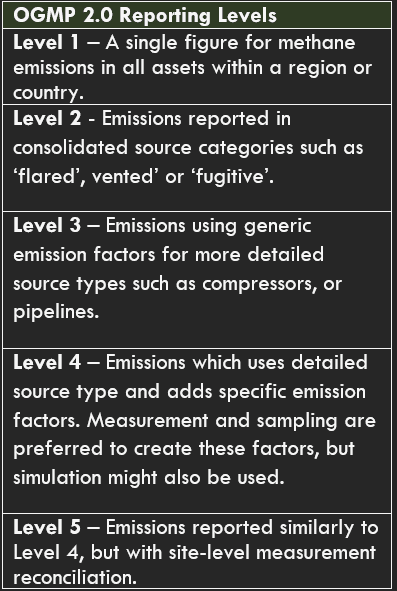
The OGMP 2.0 reporting confirms that most companies are still well short of the required level 5 reporting, where source and site level measurements are reconciled. The weighted average level of reporting from the 93 companies that were part of OGMP in 2023 was 3.0 for operated assets and 2.5 for non-operated assets. While the progress of company reporting shows an advance towards more granular methodologies, it is important to note that most company emissions numbers are not based on measurements.
Description of Methodology
Two indicators were developed from the figures reported at country level by both the IEA and the UNFCCC.
Implied Emissions from IEA Methane Tracker Data
The IEA’s Methane Tracker has been published annually since 2019. It estimates methane emissions from the oil and gas industries and, in a separate data set, publishes projections for how much of those methane emissions could be abated by either sequestrating it, or capturing it for sale as gas (resulting in carbon dioxide emissions representing only have a fraction of the warming impact from unabated methane emissions). The implied emissions technique takes the estimates for each country and subdivides them into oil and gas. It then produces methane intensities against a given volume of oil or gas in a given country by taking total production in that country in that year and allocating the total volume of emissions pro rata. For example, the Methane Tracker for 2024 estimates that there were methane emissions of 1,974 thousand tons (KT) in the upstream of Algeria’s oil industry, and 670 KT in upstream of the gas industry. Production in that year in Algeria is estimated to be 597 million barrels of oil and 549 million barrels of oil equivalent (boe) in gas. Dividing production by the total estimated emissions thus gives an average intensity per boe of 1.16 kilograms of methane per barrel of oil equivalent (boe) of gas (kg/boe) and 3.59 kg/boe for oil. Similar intensities are derived in the same way for all major oil and gas producing countries in the world. To compare this to stated goals and self-reported standards, best practice within the oil and gas industries has settled on a target methane emissions rate of 0.2% by volume in gas fields – in other words that direct emissions should not exceed this proportion of gas sent to market. This can be converted into about 0.23 kg methane per boe. The weighted average estimate of emissions in the IEA’s Methane Tracker is about 1.20 kg per boe. The IEA’s Net Zero scenario, published in 2021 and updated in 2023, argues for a 75% reduction of methane emissions in the oil and gas industry by 2030, which would bring the average down to approximately 0.30 kg/boe (assuming underlying oil and gas production remained similar over this period).
Implied Emissions from submissions to the UNFCCC
A second implied emissions intensity is supplied by similar country level projections provided by governments in submissions to the UNFCCC. The 45 countries classified as “Annex 1” have submitted estimates of methane emissions along the value chain in oil and gas industries (separately) as part of compliance reporting in the UNFCCC process. The production of these countries represented just over half of global production in 2023. The weighted average of emissions from Annex 1 countries reported to the UNFCCC was 58% of the IEA estimates for the same countries. For the remaining (Annex 2) countries, who have either not reported methane emissions or with a time lag that in many cases exceeds a decade, the IEA intensity is then factorized by 0.58 to produce a second intensity factor which proxies the numbers in the UNFCCC system.
Applying the Factors to Company Production
Each emissions intensity is applied to production listed by companies in jurisdictions where they operate. So, for example in Algeria, TE (formerly Total Energies) produced 10 mmboe of gas and 11 mmboe of oil with total projected methane emissions of 51 KT.
Limitations
The implied emissions methodologies are designed to highlight the divergences between estimations using different methodologies, and company reporting, to facilitate the development of commonly held and rigorous methodologies. As such, it is designed to be indicative, and to inform research and discussion of appropriate measurement methods rather than definitive. The implied emissions method has the following limitations:
• System Boundaries: There are potential mismatches between the boundaries defining the oil and gas production systems as defined by the three initial sources – the IEA, UNFCCC, and corporate reporting. IEA and UNFCCC have different boundaries because the numbers included here represent the entire value chain in the case of UNFCCC, but downstream sub-components are removed from IEA data, to attempt to bring comparison with corporate reporting closer, since the assumption is that most corporate reporting concentrates on the upstream. In the case of corporate reporting, emissions numbers on an equity basis have been preferred overestimates merely for operated assets, but in some cases either equity basis estimates have not been available or not clearly defined.
• Data Gaps: Comparison between company estimates and implied emissions are for the year 2022 because most companies have not yet (2024 Q2) published figures for estimated methane emissions in 2023. The latest data available under UNFCCC submissions is for 2020. The intensity factors derived from the IEA Methane Tracker 2024 are from data covering the year 2023. Country production of oil and gas, which is also not yet fully available for 2023, has been estimated by taking the known global figures of gas and oil production for 2023 and comparing them to 2022, and deriving a factor for each of gas and oil to apply to 2022 country production figures as estimates for 2023. As mentioned above, actual measurement data is required, as defined in the OGMP 2.0 reporting standards and assurance.
• No Project Level Adjustment: Using a country-level factor necessarily involves not disaggregating to project level. Differences from one project to another can vary significantly because of both above ground (management and economics) and below ground (geology) factors.
• “Other”: Companies do not exhaustively detail their production by country but often include an aggregated column of smaller volumes of production. In these cases, we have applied a blended methane emissions intensity for oil or gas which is the weighted average of country-specific averages. The proportion of production in the current sample not identified as coming from a particular country is just over 10%.
Company Results
Legend: in the tables below the column labels have the following meaning:
• MM boe: Millions of barrels of oil equivalent. Implied intensities have been developed separately for crude oil and NGL and gas and are available in the full data sheet. Both the production and the associated methane emissions estimate are aggregated here.
• Prod Pct: the proportion of production a country represents in a company’s portfolio.
• IEA CH4 (KT): The methane emissions projected from a volume of production in each country using the implied emissions methodology based on IEA Methane Tracker Data. Where CO2 equivalences have been found in corporate reporting, they are converted back into volumes of methane according to the version of UNFCCC Assessment report and Global Warming Potential factor cited by the company.
• CH4 Pct: The proportion of implied emissions a country represents in a company’s portfolio.
![]()

Global Registry of Fossil Fuels

All data is licensed under CC-BY-SA. For further information please contact the Global Registry of Fossil Fuels